What is Infographic and its Use Cases?
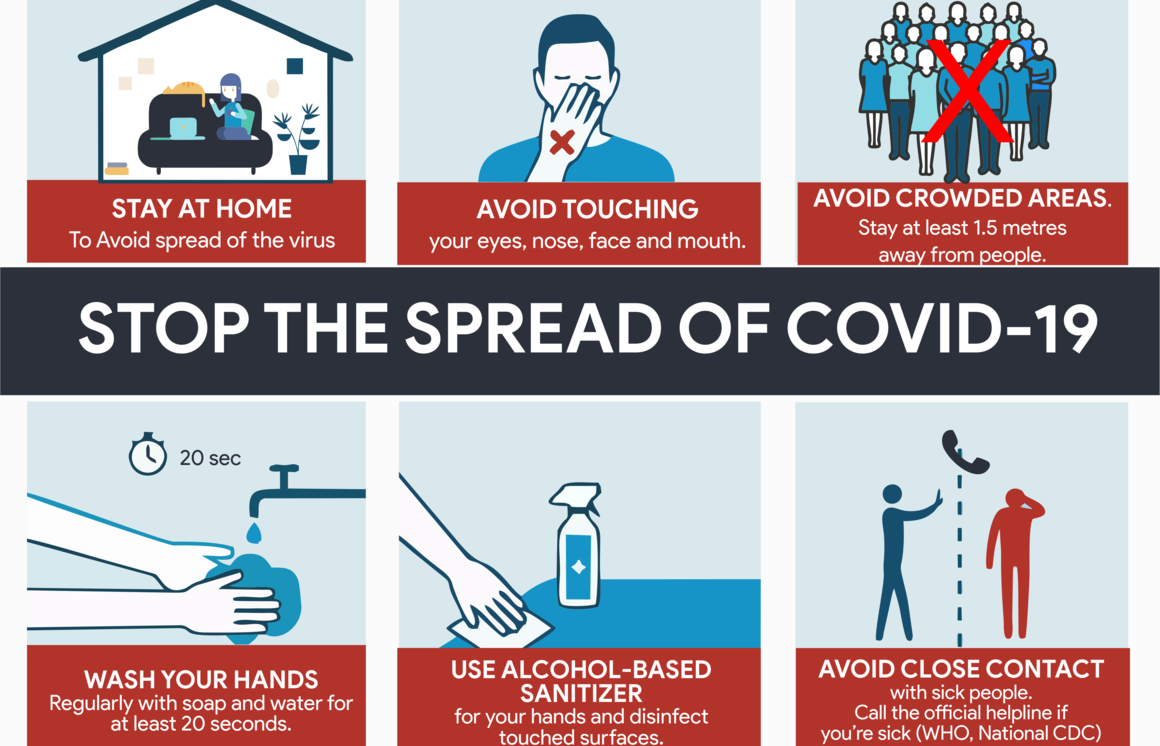
Have you ever seen an image like this during COVID19?
The answer is probably YES!

We encounter this type of posters very often, especially during the this global pandemic. It turns out it works well - we can memorize the key messages quickly and clearly, therefore improving the efficiency of getting it across to a large base of audience.
We call it infographic.
What is infographic?
By definition, an infographic is a combination of 'information' and 'graphics', a visualization presentation of certain information, knowledge or data flow quickly and clearly, for a business pitch, an idea explanation or education.
From recent studies, it shows the infographic could improve cognition by utilizing graphics to enhance the human visual system's ability to see patterns and trends. And, it is becoming increasingly popular and crucial in our current era of short attention span.
What are the infographics categories?
The three parts of all infographics are the visual, the content, and the knowledge. Accordingly, there are usually three types of infographics that most fall into:
(1)Data visualization infographics;
With exponentially growth of data each day, data visualization infographics make the information easy to digest by using charts, graphs and other visualization tools, based on the background stats, figures, numbers and facts.
Use Cases: Statistics infographics and time-series infographics are commonly used.
(2)Information design infographics;
Unlike the data visualization infographics, the information design infographics are not entirely focusing on data points display but rather the display of information more efficiently and effectively, such as designing of display a concept, a structure or relationship of information.
Use cases: Process infographics, information infographics, hierachical infographics, comparison infographics, list infographics etc.
(3)Editorial infographics;
Slightly different from above two, editorial infographic is a one that employs a narrative approach. It usually has a broader distribution potential, such as major publications, commercials, digital marketers, startups or larger corporate blogs using graphic content or “charticles” to display thought-leadership within an industry and bring attention to online traffic.
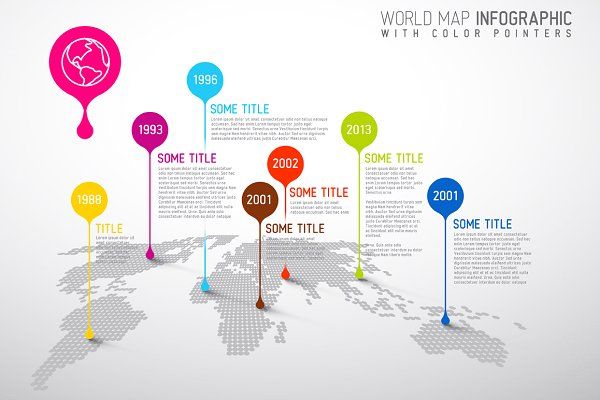
Use cases: Location-based infographics, anatomical infographics etc.

What are the styles of infographics?
Infographics are becoming more flexible in terms of its styles, allowing you to tell stories in the unique and engaging ways. With that said, below are the three commonly used styles:
(1) Static infographics;
(2) Animated infographics;
(3) Interactive infographics;
How to make a good infographic?
Knowing the end goal of a good infographic is to get message across, we have to tell a good story first, and then impress the audience and finally sell the story with a 'green light'. Here are a few crucial steps to keep in mind.
(1) Know your audience;
(2) Get your data, information, fact accurate and precise;
(3) Brainstorm the ideas, being creative and original;
(4) Illustrate with a good story boarding;
(5) Optimize the visualization;
(6) Make it interactive.
At last, start practicing by creating your own infographics, and practice makes perfect. We will also be happy to help you along the way.
Source:
1. Wikipedia;
2. What is infographic (Tips and templates);
3. Why infographic is important and how to create;
The answer is probably YES!

We encounter this type of posters very often, especially during the this global pandemic. It turns out it works well - we can memorize the key messages quickly and clearly, therefore improving the efficiency of getting it across to a large base of audience.
We call it infographic.
What is infographic?
By definition, an infographic is a combination of 'information' and 'graphics', a visualization presentation of certain information, knowledge or data flow quickly and clearly, for a business pitch, an idea explanation or education.
From recent studies, it shows the infographic could improve cognition by utilizing graphics to enhance the human visual system's ability to see patterns and trends. And, it is becoming increasingly popular and crucial in our current era of short attention span.
What are the infographics categories?
The three parts of all infographics are the visual, the content, and the knowledge. Accordingly, there are usually three types of infographics that most fall into:
(1)Data visualization infographics;
With exponentially growth of data each day, data visualization infographics make the information easy to digest by using charts, graphs and other visualization tools, based on the background stats, figures, numbers and facts.
Use Cases: Statistics infographics and time-series infographics are commonly used.
(2)Information design infographics;
Unlike the data visualization infographics, the information design infographics are not entirely focusing on data points display but rather the display of information more efficiently and effectively, such as designing of display a concept, a structure or relationship of information.
Use cases: Process infographics, information infographics, hierachical infographics, comparison infographics, list infographics etc.
(3)Editorial infographics;
Slightly different from above two, editorial infographic is a one that employs a narrative approach. It usually has a broader distribution potential, such as major publications, commercials, digital marketers, startups or larger corporate blogs using graphic content or “charticles” to display thought-leadership within an industry and bring attention to online traffic.
Use cases: Location-based infographics, anatomical infographics etc.

What are the styles of infographics?
Infographics are becoming more flexible in terms of its styles, allowing you to tell stories in the unique and engaging ways. With that said, below are the three commonly used styles:
(1) Static infographics;
(2) Animated infographics;
(3) Interactive infographics;
How to make a good infographic?
Knowing the end goal of a good infographic is to get message across, we have to tell a good story first, and then impress the audience and finally sell the story with a 'green light'. Here are a few crucial steps to keep in mind.
(1) Know your audience;
(2) Get your data, information, fact accurate and precise;
(3) Brainstorm the ideas, being creative and original;
(4) Illustrate with a good story boarding;
(5) Optimize the visualization;
(6) Make it interactive.
At last, start practicing by creating your own infographics, and practice makes perfect. We will also be happy to help you along the way.
Source:
1. Wikipedia;
2. What is infographic (Tips and templates);
3. Why infographic is important and how to create;

